Table of Contents
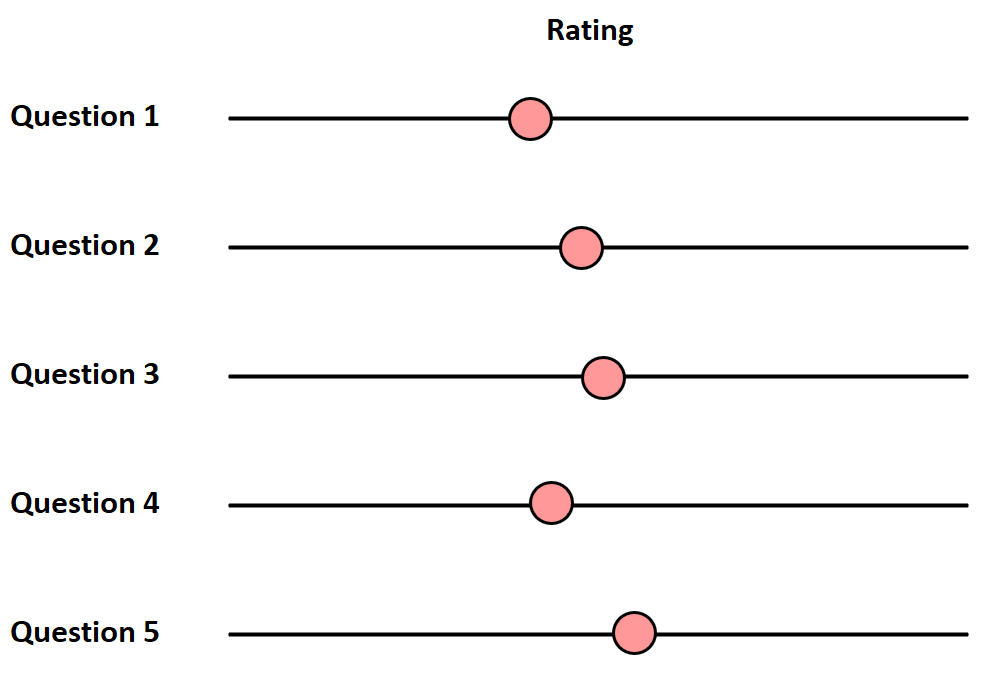
The concept of Central Tendency Bias (CTB) represents a critical and pervasive form of response bias frequently observed during data collection, particularly within survey and evaluation methodologies. This specific psychological phenomenon describes the consistent inclination of a rater or respondent to consciously or subconsciously avoid the extreme ends of a rating scale. Instead of providing highly differentiated feedback, these individuals tend to cluster their scores around the statistical central tendency—the numerical or categorical midpoint of the scale.
When evaluators consistently assign ratings like “average,” “neutral,” “satisfactory,” or “acceptable,” the resulting dataset fundamentally loses the necessary statistical variance. This lack of differentiation prevents meaningful analysis and accurate discernment among the subjects being rated. CTB significantly undermines the validity and utility of the collected information, turning potentially insightful data into a blurred, unusable mass of mediocrity.
The Core Mechanics of Central Tendency Bias
Central Tendency Bias is most prevalent in environments where the feedback carries high stakes, such as internal organizational surveys, peer reviews, and especially during employee performance appraisal cycles. In these scenarios, the results directly influence salary adjustments, promotions, and career trajectories, amplifying the psychological pressure on the rater.
Consider the common scenario involving a 10-point Likert scale, where 1 signifies “Poor” and 10 signifies “Exceptional.” Managers frequently default to scores narrowly ranging between 5 and 7. By doing this, they ensure that virtually all employees are categorized as performing “satisfactorily” or slightly “above average.” The rater avoids the complex documentation and potential conflict associated with scoring an employee as a “1” or a “2,” while also avoiding the need to justify the exceptional resource allocation that might follow a score of “9” or “10.”
This cluster effect severely restricts the range of performance data. When data points are compressed toward the middle, the standard deviation approaches zero. Statistically, low variance means that the scale is failing to measure the true diversity of performance within the group, ultimately masking both exceptional talent and critical performance gaps.
Psychological Drivers: Why Raters Choose Neutrality
Understanding the mechanism of CTB requires examining the deep-seated psychological and social pressures inherent in the evaluation process. This bias is rarely a conscious attempt to mislead; rather, it often originates from a desire to maintain social harmony, avoid confrontation, or stems from a lack of confidence in making definitive judgments about others.
One primary psychological motivator is the desire for conflict avoidance and social protection. In an organizational setting, providing a manager’s direct report with an extremely low score inevitably invites confrontation, demands extensive evidence, and can severely damage the working relationship. Conversely, assigning extremely high scores can lead to accusations of favoritism or create unrealistic expectations for rewards. The middle ground—the neutral score—serves as a safe, low-effort mechanism to sidestep these interpersonal hazards.
Furthermore, many evaluators experience what can be termed evaluation anxiety. They may feel uncomfortable acting as a judge of another person’s inherent capabilities, especially if they share a close personal or professional relationship with the individual being rated. By assigning a neutral score, the manager avoids making a definitive, high-consequence judgment that could significantly impact the employee’s future trajectory, thus alleviating their own anxiety about the judgmental role.
Interestingly, Central Tendency Bias tends to diminish significantly when the stakes are low and the relationship is impersonal. For example, in external customer satisfaction surveys, customers are generally more willing to provide polarized responses (either “Extremely Satisfied” or “Extremely Dissatisfied”). Since the customer is rating an impersonal product or service and faces no professional repercussions tied to their feedback, the social pressure to be neutral is eliminated.
The Devastating Impact on Data Validity and Decision Making
The consequences of Central Tendency Bias are severe, impacting both the statistical integrity of organizational data and the ability of leadership to make informed, strategic decisions. If CTB remains unchecked, the substantial resources invested in the data collection effort are largely wasted.
First, the data collected becomes fundamentally inaccurate and unreliable. If a manager, motivated by a fear of conflict, rates an underperforming employee as a “6” instead of a “2,” the survey data immediately fails to reflect the true level of performance. This distortion means that statistical measures—such as means, standard deviations, and correlations—are calculated based on false premises. The resulting organizational insights derived from this skewed data are likely to be flawed, leading to misallocation of resources and misguided policy development.
Second, the data is rendered ineffective for strategic human resource decision-making. When employee responses are heavily clustered in the middle of the scale (e.g., 80% of employees score between 5 and 7), the data lacks the variance required to differentiate between genuine high performers, average contributors, and those who urgently require intervention or training.
This inability to differentiate creates significant practical problems for organizational effectiveness. It becomes virtually impossible to:
- Identify and Reward Top Talent: Recognizing individuals truly deserving of promotions, bonuses, or advanced leadership training.
- Targeted Intervention: Pinpointing specific employees or teams that are struggling and require specialized coaching or disciplinary action.
- Validate Programs: Assessing the genuine effectiveness of training initiatives or new management strategies, as performance appears uniformly adequate regardless of the intervention.
Differentiating Central Tendency from Other Rating Errors
Central Tendency Bias is just one of several common rating errors, and effective mitigation requires organizations to understand how it differs from other, often co-occurring, biases that distort evaluation data.
The key distinction lies in the direction of the deviation: CTB compresses responses, while other biases skew them toward an extreme.
- Leniency Bias: This error occurs when raters consistently provide overly high scores, shifting the average response toward the positive end of the scale (e.g., scores clustered around 9 or 10). This bias is often driven by empathy, a desire to be liked, or a belief that having high-performing subordinates reflects positively on the manager.
- Severity Bias: The polar opposite of Leniency Bias, Severity Bias involves raters consistently utilizing the low end of the scale (e.g., scores clustered around 1 or 2). This might be caused by a rater possessing exceptionally high personal standards, a cynical viewpoint, or a deliberate attempt to motivate improvement through harsh feedback.
- Halo Effect: This error occurs when a rater’s overall positive (or negative) impression of an individual influences their rating across all specific performance categories, regardless of actual skill level in those discrete areas. For example, an employee who is punctual might receive high scores for creativity, even if their creative output is low.
Central Tendency Bias is unique because the responses are not skewed toward a favorable or unfavorable extreme; instead, they are compressed toward the exact midpoint. This compression eliminates standard deviation and meaningful distinctions, making it statistically impossible to identify outliers. Addressing CTB requires techniques designed specifically to force differentiation rather than merely correcting for overly generous or overly harsh scoring.
Strategic Mitigation: Adjusting Process and Design
To effectively combat CTB and encourage raters to utilize the full spectrum of the rating scale, organizations must strategically adjust both the administrative procedures governing the evaluation process and the fundamental design of the survey instruments themselves.
One major procedural barrier is the disproportionate administrative overhead associated with extreme ratings. Many systems require managers to provide extensive, time-consuming written justification only for unusually high or low scores. This acts as a powerful disincentive; if assigning a “5” requires two minutes and assigning a “1” requires two hours of detailed documentation, the manager will naturally gravitate toward the middle to save time and effort.
By removing the requirement for managers to provide detailed justification solely for extreme ratings—or, alternatively, by requiring justification for *all* ratings equally—organizations can lower the operational friction associated with providing honest, differentiated feedback. This procedural shift encourages raters to be more truthful, as they do not face additional punitive paperwork for offering accurate, if extreme, scores.
Another highly effective strategic intervention is the introduction of Forced Differentiation Methods, which shift the evaluation focus from absolute scoring to relative comparison. Relative ranking techniques eliminate the possibility of rating everyone as “average” because the manager is required to compare individuals directly against one another.
Instead of asking, “Rate Employee X’s performance from 1 to 10,” a forced differentiation approach might ask, “Rank your team members from 1 (Highest Performer) to 5 (Lowest Performer).”
Advanced methods include:
- Simple Rank Order: Listing all subjects from best to worst based on a single criterion.
- Paired Comparison: A systematic process where every employee is compared against every other employee individually, generating a robust, objective hierarchy.
- Forced Distribution: This highly effective, though often controversial, method requires managers to place a predefined percentage of employees into specific performance categories (e.g., 10% must be “Exceeds Expectations,” 80% “Meets Expectations,” and 10% “Needs Improvement”). By mandate, this technique effectively eradicates Central Tendency Bias.
Furthermore, organizations must invest heavily in Rater Training and Calibration. Raters often lack the necessary objectivity and skill to apply complex rating scales consistently. Comprehensive training programs should educate managers on all common rating biases, including CTB, Leniency, Severity, and the Halo Effect. Training should incorporate mock rating exercises and clear discussions on the operational definitions of performance levels. Crucially, calibration meetings—where groups of managers review and justify their initial ratings before final submission—are implemented. This peer review process holds raters accountable, standardizes the application of the scale, and makes it significantly more challenging for a manager to justify giving all employees a neutral score without credible evidence.
Designing for Clarity: Implementing Behaviorally Anchored Rating Scales (BARS)
Ambiguity within the survey instrument itself is perhaps the most significant structural cause of Central Tendency Bias. When a question or metric is vague, raters often assign a middle score because they are genuinely unsure how to interpret or apply the metric accurately. To overcome this, ensuring survey questions are crystal clear and anchored with specific behavioral examples is critical.
Contrast the pitfalls of poorly defined questions with the power of clearly articulated behavioral anchors.
Vague Survey Examples (Prone to CTB):
- How responsible is employee X on a scale of 1-10?
- How would you rate the leadership of employee X on a scale of 1-10?
These questions lack context. Does “responsible” mean consistent on-time delivery, or owning up to mistakes? Since the definition is missing, raters default to the safe, average rating rather than risk misinterpretation.
Revised Survey Examples using Behavioral Anchors (Combating CTB):
- Rate the responsibility of employee X on a scale of 1-10, with 1 indicating that they frequently miss deadlines and require constant supervision; 5 indicating that they reliably complete assigned tasks with moderate oversight; and 10 indicating that they are completely responsible for their actions, proactively addressing issues and consistently delivering high-quality work without supervision.
- Rate the leadership of employee X on a scale of 1-10, with 1 indicating that they have never taken a leadership role and actively resist responsibility; 5 indicating that they take on leadership roles only when directed and show basic management skills; and 10 indicating that they consistently seek out leadership opportunities, mentor others, and exhibit exceptional leadership traits on all projects when needed.
This revised structure, known formally as a Behaviorally Anchored Rating Scale (BARS), is significantly more likely to produce accurate and differentiated data. By providing concrete, observable behavioral definitions for the scale’s end-points and midpoint, managers are given a clear framework for evaluation. This mechanism reduces the reliance on arbitrary or safe middle ratings, thereby proving highly effective in combating Central Tendency Bias.
Cite this article
Mohammed looti (2025). Understanding Central Tendency Bias: A Guide to Avoiding Midpoint Bias in Surveys. PSYCHOLOGICAL STATISTICS. Retrieved from https://statistics.arabpsychology.com/what-is-central-tendency-bias/
Mohammed looti. "Understanding Central Tendency Bias: A Guide to Avoiding Midpoint Bias in Surveys." PSYCHOLOGICAL STATISTICS, 5 Nov. 2025, https://statistics.arabpsychology.com/what-is-central-tendency-bias/.
Mohammed looti. "Understanding Central Tendency Bias: A Guide to Avoiding Midpoint Bias in Surveys." PSYCHOLOGICAL STATISTICS, 2025. https://statistics.arabpsychology.com/what-is-central-tendency-bias/.
Mohammed looti (2025) 'Understanding Central Tendency Bias: A Guide to Avoiding Midpoint Bias in Surveys', PSYCHOLOGICAL STATISTICS. Available at: https://statistics.arabpsychology.com/what-is-central-tendency-bias/.
[1] Mohammed looti, "Understanding Central Tendency Bias: A Guide to Avoiding Midpoint Bias in Surveys," PSYCHOLOGICAL STATISTICS, vol. X, no. Y, ص Z-Z, November, 2025.
Mohammed looti. Understanding Central Tendency Bias: A Guide to Avoiding Midpoint Bias in Surveys. PSYCHOLOGICAL STATISTICS. 2025;vol(issue):pages.